Spring Maths Year 2 statistics resources, White Rose Maths statistic resources
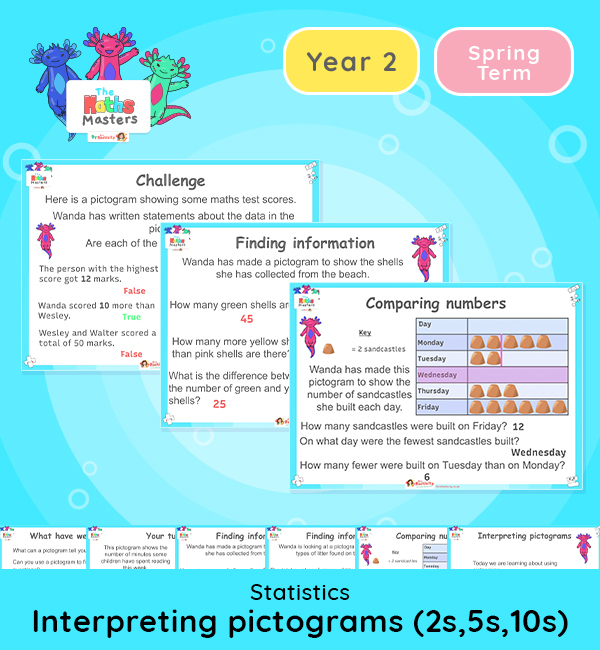
In year 2, children will learn about various statistical concepts, including tally charts, bar charts, and pictograms. These concepts are introduced in a way that makes them accessible and engaging for young learners, with practical examples and real-life scenarios. Learning about statistics improves children’s analytical and critical thinking. Children in year 2 are taught how to collect and sort data into pictograms, bar charts, and tally charts or tables. They are also taught to use the data they have organised, to ask and answer questions, either by counting individual groups, comparing categories, or adding up two or more categories.
Following the White Rose Maths progression for year 2 statistics, children will gain a solid understanding of the basics of statistics, which will help them to interpret and make sense of data throughout their education and beyond. Additionally, the skills and knowledge gained from this curriculum will provide a strong foundation for further mathematical learning in years to come.
We use cookies on our website to give you the most relevant experience by remembering your preferences and repeat visits. By clicking “Accept”, you consent to the use of ALL the cookies.
This website uses cookies to improve your experience while you navigate through the website. Out of these, the cookies that are categorised as necessary are stored on your browser as they are essential for the working of basic functionalities of the website. We also use third-party cookies that help us analyse and understand how you use this website. These cookies will be stored in your browser only with your consent. You also have the option to opt-out of these cookies. But opting out of some of these cookies may affect your browsing experience.
Necessary cookies are absolutely essential for the website to function properly. This category only includes cookies that ensures basic functionalities and security features of the website. These cookies do not store any personal information.
Functional cookies help to perform certain functionalities like sharing the content of the website on social media platforms, collect feedbacks, and other third-party features.
Performance cookies are used to understand and analyze the key performance indexes of the website which helps in delivering a better user experience for the visitors.
Analytical cookies are used to understand how visitors interact with the website. These cookies help provide information on metrics the number of visitors, bounce rate, traffic source, etc.
Cookie
Duration
Description
_fbp
3 months
Facebook sets this cookie to display advertisements when either on Facebook or on a digital platform powered by Facebook advertising after visiting the website.
_ga
1 year 1 month 4 days
Google Analytics sets this cookie to calculate visitor, session and campaign data and track site usage for the site's analytics report. The cookie stores information anonymously and assigns a randomly generated number to recognise unique visitors.
_ga_*
1 year 1 month 4 days
Google Analytics sets this cookie to store and count page views.
_gcl_au
3 months
Google Tag Manager sets the cookie to experiment advertisement efficiency of websites using their services.
Advertisement cookies are used to provide visitors with relevant ads and marketing campaigns. These cookies track visitors across websites and collect information to provide customized ads.
Cookie
Duration
Description
fr
3 months
Facebook sets this cookie to show relevant advertisements by tracking user behaviour across the web, on sites with Facebook pixel or Facebook social plugin.
NID
6 months
Google sets the cookie for advertising purposes; to limit the number of times the user sees an ad, to unwanted mute ads, and to measure the effectiveness of ads.
VISITOR_INFO1_LIVE
6 months
YouTube sets this cookie to measure bandwidth, determining whether the user gets the new or old player interface.
VISITOR_PRIVACY_METADATA
6 months
YouTube sets this cookie to store the user's cookie consent state for the current domain.
YSC
session
Youtube sets this cookie to track the views of embedded videos on Youtube pages.
yt-remote-connected-devices
never
YouTube sets this cookie to store the user's video preferences using embedded YouTube videos.
yt-remote-device-id
never
YouTube sets this cookie to store the user's video preferences using embedded YouTube videos.
yt.innertube::nextId
never
YouTube sets this cookie to register a unique ID to store data on what videos from YouTube the user has seen.
yt.innertube::requests
never
YouTube sets this cookie to register a unique ID to store data on what videos from YouTube the user has seen.